One reason so many are quitting: We want control over our lives again
The pandemic, and the challenges of balancing life and work during it, have stripped us of agency. Resigning is one way of regaining a sense…
Thought Leader: Amy Cuddy
We often learn something new from studying something old. More than 150 years before Mark Zuckerberg used the term the “social graph” to describe your network of connections on Facebook, a trailblazing engineer named Daniel McCallum invented the “organisational chart”.
As general superintendent of the New York and Erie Railroad in 1855, McCallum grappled with the challenges presented by new technologies that were reshaping the scale and complexity of organisations. His solution was as elegant as it was profound: the invention of the first-ever organisational chart. It was a design artefact that would go on to change people’s working lives for ever.
I first stumbled across this object of surprising beauty a couple of years ago while browsing the archives of the Library of Congress in Washington, DC. With pressing questions about the future of work, I wanted to dive into the past, exploring how visionaries across disciplines first conceived ideas such as productivity, authority and delegation. What I discovered was a fascinating trove of design thinking.
In the mid-1800s, rail networks were expanding at an unprecedented pace. The possibilities for travel and trade were reshaping economies, while the nature of work itself was evolving rapidly. McCallum faced a problem: how to co-ordinate the movement of goods and workers across around 200 trains, 3,000 carriages, and 4,700 employees, spread out over hundreds of miles of track. The stakes were high. A delayed train on a single track could disrupt the entire system, and schedule changes increased the risks of deadly crashes.
The informal, ad hoc management style that worked on smaller railroads was proving inadequate at scale. In a report to the board and shareholders in 1856, McCallum observed: “A superintendent of a road only 50 miles in length . . . knows everyone, and all questions in relation to its operation are easily presented and acted upon.”
Managing a 50-mile railroad, he noted, was not unlike running a single general store. But with 500 miles of track, a different approach to management and organisation was needed. The challenge was further compounded by the rise of the telegraph. Suddenly, information could travel in minutes rather than days or weeks. Paradoxically, this influx of real-time data made decision-making more difficult, not easier. There was more information than ever about everything from train delays to mechanical problems and broken equipment, but people didn’t know what to do with it. Sound familiar?
The Scottish-born McCallum was a powerfully built man with a long, flowing beard. He had worked his way up from carpenter to bridge engineer, then regional manager, before becoming superintendent of the entire railroad. McCallum excelled in many things, including poetry, but his true gift was making complex things clear. What’s needed, he wrote in his report, is a “system perfect in its details, properly adapted and vigilantly enforced.” Decision-making needed to be distributed better through the organisation.
McCallum put pen to paper and outlined six principles for managing large organisations that sound remarkably modern. The right number of responsibilities should be divided clearly. Power should be delegated. Autonomy should be granted. Authority should match responsibility, and so on. It was a moment of quiet significance, the first known instance of a leader formally articulating what would later be taught in business schools as management theory.
But words alone were not enough. McCallum recognised the need for a way to visually convey power, trust and relationships in a fast-moving organisation. Working closely with George Henshaw, a talented young engineer and draughtsman, he devised a breakthrough in design thinking: the first known org chart.
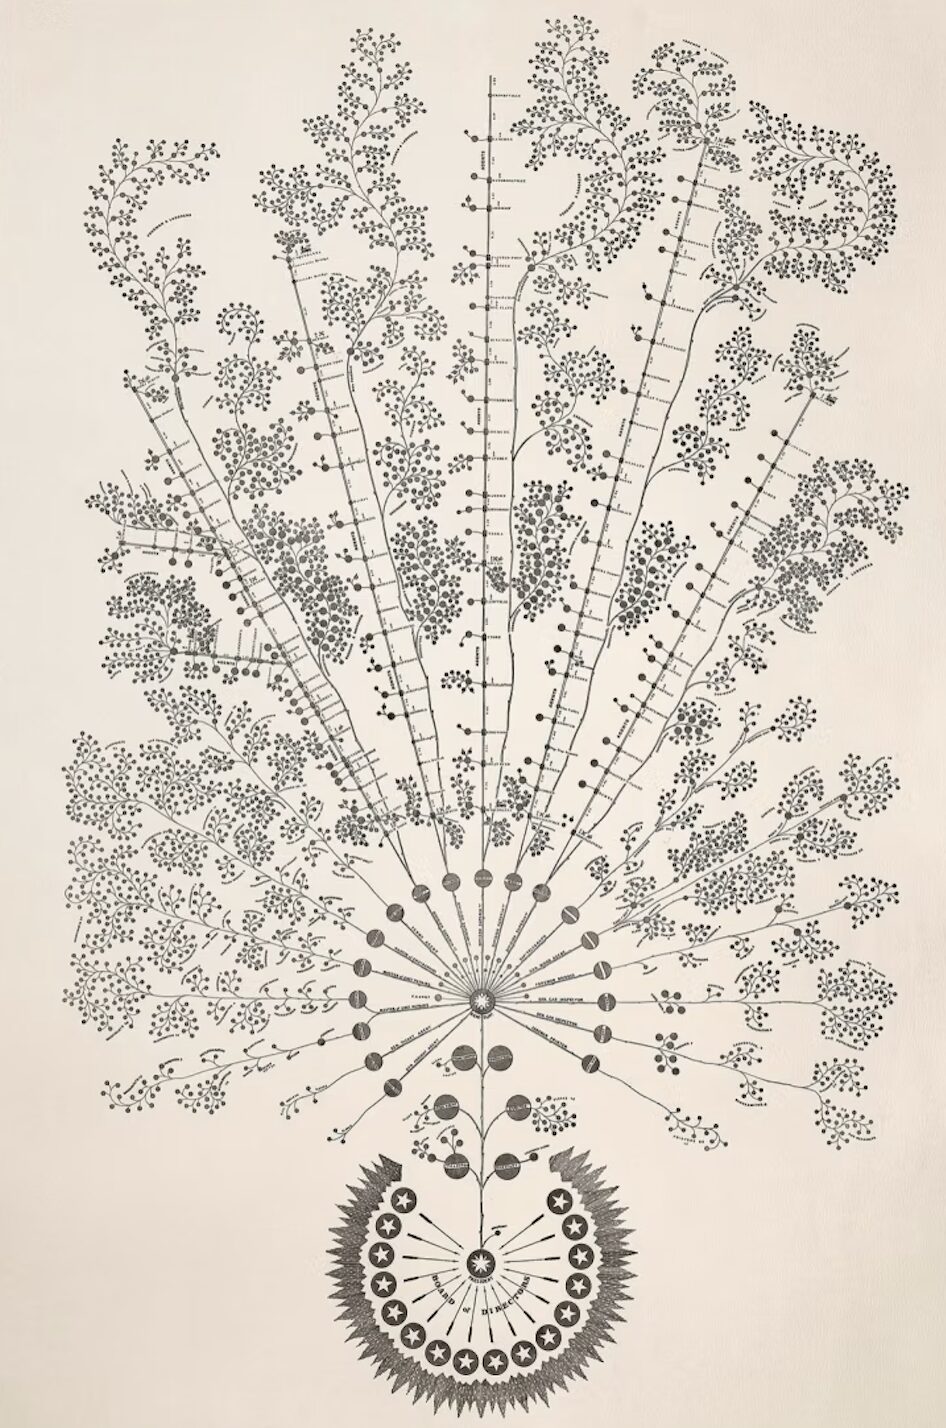
What struck me when I first saw the design was that it was nothing like the pyramid we are so familiar with today. Instead of a linear, rigid, top-down structure, its delicate strokes and flowing organic lines formed something altogether different. From a distance, it resembled a tree abundant with blossoms.
The roots of the tree — its foundation — symbolised the president and board of directors. Above that was a central hub from which 17 spokes of service divisions radiated, each overseen by line managers, from the general car inspector to the master of repairs. The executive leadership formed a sturdy trunk, while the frontline workers extended outwards along the branches — perhaps to symbolise the growth of the railroads. McCallum, whose office as general sat at the very centre of all this activity, had literally turned the traditional notion of hierarchy upside down.
His reasoning was simple, yet radical for the time. Those closest to the action were best placed to make decisions. Local supervisors had direct access to real-time information, allowing them to co-ordinate trains and workers more effectively. McCallum’s chart redefined leadership not as centralised command, but as a distributed system where authority flowed outward and influence was gained by relinquishing control.
When I first came across the chart a few years ago, it was discoloured, frayed at the edges, and its tiny print made the details difficult to read. I felt a strong urge to restore it — to uncover exactly what was there — while respecting the craftsmanship and physical integrity of the original design.
Collaborating with Graham Bignell and Richard Ardagh at New North Press, east London’s oldest letterpress studio, the design’s intricacies were brought back to life using traditional printing equipment and techniques that have endured for more than 500 years.
We experimented with various papers, adjusting ink and pressure on the old hand-operated printing press to try to ensure all the fine details were legible. Between each print, the metal plate had to be meticulously cleaned with a cotton bud. It was the antithesis of digital production — slow and patient.
Every time I examined the design under a magnifying glass, I discovered something new and intriguing. The elegant, organic “branches” represented the five operating divisions, while the tiny leaves denoted different worker roles — timekeepers, wipers, porters, brakemen, carpenters, masons, painters, clerks. Along the tracks, every train station is marked, with the mileage between each stop carefully noted. Even the various amenities, such as the “eating saloons” symbolised by a knife and fork, are depicted at each location. The level of detail and care is extraordinary.
We all recognise the dots and dashes of Morse Code, which revolutionised long-distance communication. The periodic table, Dmitri Mendeleev’s masterful organisation of chemical elements, is a fixture in classrooms around the globe. John Venn’s diagrams, which visually represent logical relationships, form the foundation of modern communication. Yet, the first-ever organisational chart lay largely forgotten in the Library of Congress for 170 years. It’s fascinating how something of such historical significance has remained largely unknown.
This June, for the London Design Biennale I will reimagine McCallum’s design through an immersive light and shadow installation titled “Roots of Trust”. Etched on to a floating transparent panel and softly illuminated, the artefact casts shifting shadows throughout the space, evoking the fluidity and complexity of human dynamics. Organisations are not rigid, linear machines; they are complex ecosystems of people, processes, systems and the ever-evolving chemistry between them.
The installation’s nature-inspired beauty stands in contrast to the hierarchical models many organisations still rely on to define roles and authority. It wasn’t until almost a century after McCallum’s graph that the concept of the “org chart” truly took hold, with the rise of business schools. When it did, it looked very different. In 1914, Henri Fayol, a French management theorist, was the next to create a visual representation of an organisation for a large stove-manufacturing company. His chart was based on his principle of the “scalar chain”, which broke jobs down into individual tasks and emphasised a clear chain of command. In his seminal work, General and Industrial Management, Fayol wrote: “To manage is to forecast and plan, to organise, to command, to co-ordinate and to control.”
In 1917, the pyramidal hierarchy of the org chart was designed by Herman Hollerith, founder of the Tabulating Machine Company (which later became IBM). McCallum and Henshaw’s organic, treelike design was gone, and in its place were job ranks, assembly lines, cubicles and steep hierarchies — systems that, while efficient, fail to capture the complexities of human relationships and workplace culture. Formalising relationship dynamics into clean, ordered structures might look good on paper (or the screen) and give us the illusion of control, but power and trust at work are anything but neat and ordered. At their best, these charts should act as visual maps, helping work get done and illustrating how an organisation truly functions, not simply showing who reports to whom.
In many ways, we are now facing a challenge similar to the one McCallum confronted more than 170 years ago: how do we redesign organisations in response to a fundamental technological shift in the way work is done, communicated and organised? The rigid organisational pyramid of the industrial age needs rethinking and replacing with something stable, yet more organic — perhaps a jellyfish or fungal mycelium; an ever-evolving array of circles that can form, coalesce or collapse in response to the changing environment.
More than ever, we need design thinking to reimagine fixed systems and structures that are fundamentally collapsing, broken or no longer relevant. In restoring and reimagining McCallum’s historical artefact over the past couple of years, I’ve learnt a powerful lesson: to innovate and think differently, start with the roots.
Rachel Botsman is a world-renowned authority on trust and how it shapes business, technology, and society. With engaging storytelling and clear frameworks, she helps leaders and organizations understand how trust is built, lost, and regained in a rapidly changing world. Audiences leave her talks with actionable insights on navigating uncertainty and fostering meaningful connections—making her an exceptional keynote speaker for any forward-looking event. To bring Rachel to your next event, contact WWSG today.
One reason so many are quitting: We want control over our lives again
The pandemic, and the challenges of balancing life and work during it, have stripped us of agency. Resigning is one way of regaining a sense…
Thought Leader: Amy Cuddy
Molly Fletcher: Can drive offset your burnout at work?
This piece is by Molly Fletcher. People assume that drive depletes energy. They believe that level of intensity, focus and daily effort leads to burnout.…
Thought Leader: Molly Fletcher
Paul Nicklen: A Reverence for Nature
Standing in front of any of Canadian photographer Paul Nicklen’s large-scale images in the current exhibition at Hilton Contemporary, one cannot help but be totally…
Thought Leader: Paul Nicklen
Rachel Botsman: Trust fall
Thought Leader: Rachel Botsman
Rachel Botsman: Trust Issues At Work?
Thought Leader: Rachel Botsman